 Addy
Addy  Addly
Addly  Goalify
  Monet
Monet  Reviso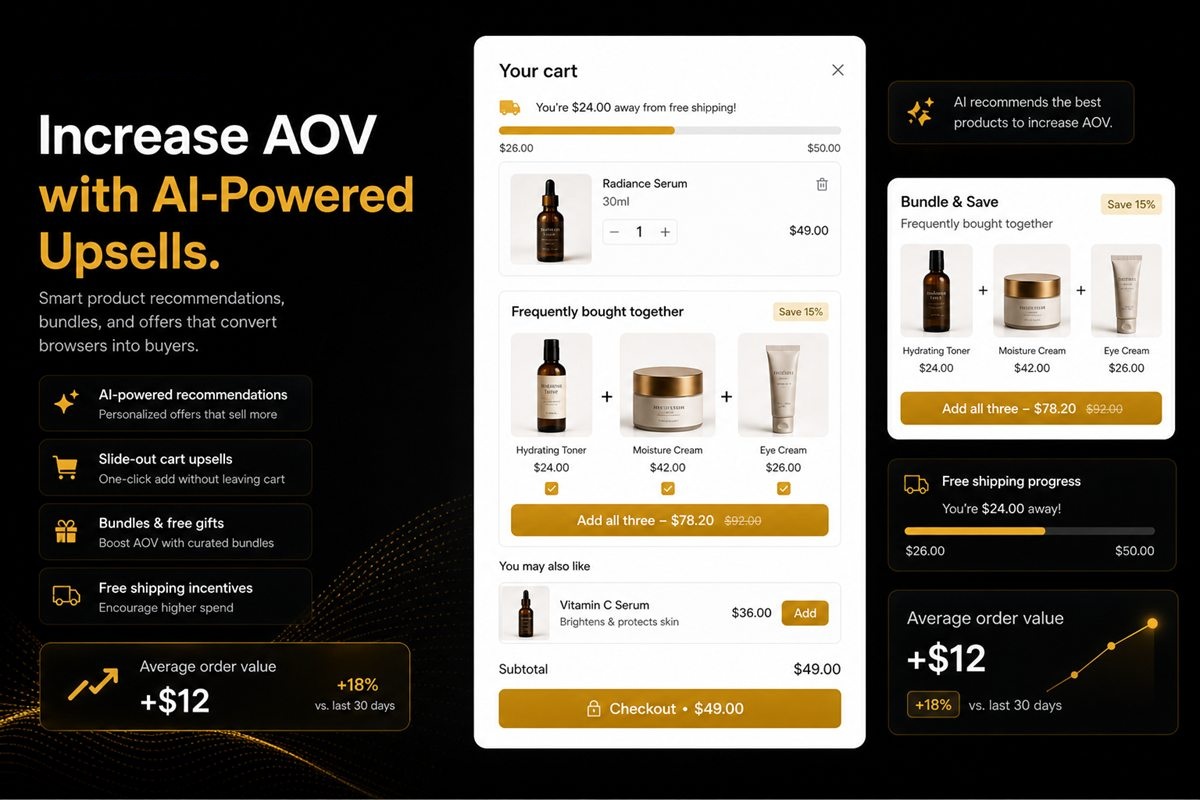
Key takeaways
- AOV is the only growth lever that costs nothing per additional order and compounds across every channel you already run.
- The eleven working levers split into four funnel positions — product page, cart, exit, post-purchase — and you should own all four eventually, one at a time.
- Measure AOV alongside conversion rate and margin per order. A tactic that lifts AOV while dropping conversion or margin has made you poorer.
- Free shipping thresholds and quantity breaks are the fastest wins; personalised bundles and post-purchase upsells have the highest ceiling.
There are exactly three ways to make an ecommerce store bigger. Get more visitors. Convert more of them. Or make each order worth more.
The first is a budget question and gets more expensive every year. The second is real work with a hard ceiling — most categories top out somewhere between two and four percent, and getting from 2.1% to 2.4% takes months of testing. The third is the one most stores treat as an afterthought, and it is the only one where the improvement is permanent, applies to every channel simultaneously, and costs nothing per additional order.
This guide is the complete version: the eleven levers that reliably work, where each belongs, and how to decide which one deserves your next week.
The maths that makes this worth reading
Take a store doing 1,000 orders a month at a $58 average order value. That is $58,000 in monthly revenue.
Now add $9 to the average order. One accessory, one quantity break, one nudge across a free shipping line. Same traffic, same conversion rate, same ad spend.
| Before | After +$9 AOV | After +15% conversion | |
|---|---|---|---|
| Orders / month | 1,000 | 1,000 | 1,150 |
| Average order value | $58 | $67 | $58 |
| Revenue | $58,000 | $67,000 | $66,700 |
| Extra ad spend | — | $0 | ~$4,400 |
| Extra gross profit (at 55% margin) | — | $4,950 | $400 |
Both columns produce roughly the same revenue. Only one of them produces meaningful profit, because a conversion-rate win still carries the acquisition cost of the extra sessions, while an AOV win carries almost no marginal cost at all.
That asymmetry is the entire argument. It is also why AOV work is usually the highest return-on-effort project available to a store doing more than a few hundred orders a month.
Measure three numbers, not one
The single most common mistake is optimising AOV in isolation. Every tactic below can be gamed into a higher average order value while making the business worse. Watch all three of these together:
- Average order value — revenue ÷ orders, for a fixed window.
- Conversion rate — sessions that end in an order. If a tactic adds friction before commitment, this drops.
- Gross profit per order — revenue minus COGS minus discount minus shipping cost, ÷ orders. This is the number that pays your rent.
A bundle that lifts AOV from $58 to $71 by giving away 30% is often a loss. A free shipping threshold set below your true fulfilment cost raises AOV and destroys margin. Always run the third number.
The four positions
Every AOV tactic sits at one of four points in the journey. They behave differently and they compound, because a shopper who adds an accessory on the product page can still cross a shipping threshold in the cart and still accept a post-purchase offer.
| Position | Shopper state | What works here | Risk to conversion |
|---|---|---|---|
| Product page | Still deciding | Bundles, quantity breaks, frequently bought together | Medium — can add friction |
| Cart | Committed to buying | Progress bars, in-cart upsells, gift thresholds | Very low |
| Exit / checkout start | Leaving or converting | Exit-intent offers, add-to-cart popups | Low if intent-triggered |
| Post-purchase | Already paid | Order edits, upsells on the confirmation and edit screens | Zero |
Most stores start at the cart, because the risk is lowest and the effect is quickest. That is the right instinct.
Lever 1: The free shipping threshold
The highest-leverage single change most stores can make, and the one most often set by guesswork.
Free shipping is not a discount; it is a goal. It converts a passive basket into an active one by giving the shopper a number to reach. The mechanic works even when the shipping fee it replaces was small, because the shopper is no longer weighing $6.90 against convenience — they are chasing a finish line.
Setting the number properly:
- Pull your order value distribution for the last 90 days, not your average. The average hides the shape.
- Find the 60th–75th percentile of order value. Your threshold belongs in that band.
- Sanity-check against margin: the gross profit on the incremental spend must exceed your average shipping cost.
- Set it per country. A €75 threshold in Germany and a €75 threshold in Bulgaria are not the same offer.
A threshold set at your median order value is too low — most shoppers cross it without changing behaviour and you have simply given away shipping. A threshold set at twice your median is too high — it reads as unreachable and shoppers disengage from the goal entirely.
Lever 2: The progress bar
The threshold does nothing if the shopper cannot see how close they are. A progress bar turns an abstract policy line into a live, personal, incomplete task — and incomplete tasks are uncomfortable in a way that reliably produces one more item.
Three things separate a bar that works from a bar that decorates:
- It must show the remaining amount, in the shopper's currency. "Spend $23 more for free shipping" beats "Free shipping over $75" by a wide margin, because one is about them and the other is about you.
- It must appear where the decision happens. The cart drawer first, the cart page second, the product page third. A sticky top bar is useful reinforcement but rarely the primary driver.
- It must celebrate the crossing. The state change when the goal is met is what makes the next goal credible.
Lever 3: Stacked goals
One threshold captures one behaviour change. A shopper who lands at $76 on a $75 free shipping threshold has no reason to go further, and you have left the entire upper half of your distribution untouched.
Stacked goals fix this by revealing the next target the moment the current one is met:
- $50 → free shipping
- $85 → 10% off the order
- $130 → free gift
Each threshold is placed at a percentile of your distribution rather than at a round number that felt nice. The result is a mechanic that keeps working across the whole range of basket sizes instead of only at one point on it.
The margin discipline here is straightforward: the cost of each reward must be less than the gross profit on the incremental spend required to unlock it. Model each tier separately.
Lever 4: Quantity breaks
The simplest bundle there is: buy two, save 10%; buy three, save 15%. No pairing logic, no catalogue work, no design decisions beyond a table.
Quantity breaks work best on consumables, anything with a predictable replenishment cycle, and anything where the shopper's real question is "how many" rather than "which one". They work poorly on considered single purchases — nobody wants two sofas.
The maths matters more than the design. A 15% discount on three units is only worth taking if your gross margin comfortably exceeds it and the customer would not have bought three units anyway. Cannibalisation is the real cost of a quantity break, and it is invisible in the AOV number.
Lever 5: Frequently bought together
The classic, and still the highest-converting product-page upsell when the pairs are right.
The mistake is picking pairs by category. A phone case and a phone are the same category; a phone case and a screen protector are the pair that sells. The only reliable source for good pairs is your own order history — which products actually appear in the same basket, at what frequency, in what order.
Rules of thumb that hold up:
- Two or three suggestions, never a grid of eight. Choice paralysis is real and it costs conversions.
- The suggested item should be meaningfully cheaper than the anchor product. Roughly 15–40% of the anchor price is the comfortable zone.
- One-click add, no page reload, no navigating away from the product being considered.
Lever 6: Cross-sells in the cart drawer
The cart is the most under-used surface in ecommerce. The shopper has committed. There is no risk of losing the sale by showing them something else, because the decision to buy has already been made.
A good cart drawer does four jobs at once: it shows the contents, it shows progress toward a goal, it offers one or two relevant additions, and it removes uncertainty about delivery. Most default theme carts do only the first.
Lever 7: Product add-ons
Warranties, gift wrap, shipping protection, express handling, engraving, a spare part. Add-ons are unusually profitable because their cost of goods is often near zero and they do not cannibalise anything.
The rule is that an add-on must be genuinely optional and genuinely useful. Shipping protection that is pre-ticked is a dark pattern, will generate chargebacks, and in several jurisdictions is now illegal. Shipping protection offered honestly, unticked, with a clear explanation, converts at a rate that will surprise you.
Lever 8: Intent-triggered popups
Popups have a bad reputation because most of them are timed. A popup on a five-second timer interrupts a shopper who is still deciding, which is precisely the wrong moment.
Intent triggers invert this:
- Add to cart — fires after commitment. The wallet is already open and the shopper is in a buying frame of mind. This is the single best upsell slot most stores own.
- Checkout initiation — one last relevant offer before they leave the storefront.
- Exit intent — the shopper is leaving anyway. There is no conversion left to lose.
None of these interrupt browsing, which is why they do not cost conversion rate the way timed popups do.
Lever 9: Personalised recommendations
Rules-based recommendations ("customers who bought X also bought Y") are a good default. Learned recommendations that read your actual order history beat them once you have enough data, mainly because they keep working when your catalogue and season change and a static rule does not.
The honest caveat: below roughly 500 orders of history, a well-chosen manual pairing usually outperforms a model. Personalisation is a scale advantage, not a starting point.
Lever 10: Post-purchase offers
The confirmation page is the highest-intent surface in ecommerce and most stores put a tracking link on it. The shopper has just paid, the friction of entering payment details is behind them, and their disposition toward your brand will never again be as positive as it is in that moment.
Anything you can offer that does not require re-entering payment details will convert at rates that look like errors compared to pre-purchase offers.
Lever 11: Order editing as a revenue surface
The most overlooked lever on this list. Between "order placed" and "parcel shipped" there is a window where the customer's needs can still change — and today, most stores handle that window with an email to support.
Letting the customer edit the order themselves does three things at once. It removes a support ticket. It prevents a cancellation, because a shopper who cannot fix a mistake will often just cancel the whole thing. And it puts a warm, engaged buyer on a page you control, where a relevant recommendation converts extremely well.
What to do first
Ordered by return on the time it takes:
- This week — put a free shipping progress bar in the cart with a threshold set from your actual distribution.
- This month — add quantity breaks to your top ten SKUs by unit volume, and frequently-bought-together pairs derived from real order data.
- This quarter — replace the default cart drawer with one that does upsells and delivery estimates, and add an add-to-cart popup.
- Next quarter — build the post-purchase surface: order editing, cancellation deflection and a confirmation-page offer.
The honest failure modes
Things that raise AOV and should not be done:
- Pre-ticked add-ons. Illegal in the EU under the Consumer Rights Directive, and a reliable source of chargebacks everywhere else.
- Fake countdown timers. A timer that resets on refresh is a lie, it is enforceable as one, and shoppers notice more often than you think.
- Thresholds you cannot honour. A free shipping line that quietly excludes half your catalogue produces more support tickets than revenue.
- Six upsells on one page. Every additional offer dilutes the others and adds cognitive load. One good offer beats four mediocre ones every time.
Where this leaves you
Average order value is not a growth hack; it is a structural property of how your store is built. Stores with high AOV are not lucky — they have deliberately designed four moments in the journey to make spending slightly more the natural thing to do.
Pick the moment that leaks the most, fix it properly, measure gross profit per session, and then move to the next one.
Frequently asked questions
What is a good average order value for a Shopify store?
There is no universal benchmark because AOV is a function of your price point. The number that matters is your own trend line and your AOV relative to blended customer acquisition cost. A store with a $40 AOV and a $12 CAC is far healthier than one with a $180 AOV and a $150 CAC. Track the ratio, not the absolute.
How quickly can I increase average order value?
A free shipping progress bar or a quantity break can be live in under an hour and will usually show a measurable effect within two weeks at moderate order volume. Deeper work — bundle architecture, personalised recommendations, post-purchase flows — takes a quarter to tune properly but has a much higher ceiling.
Does increasing AOV hurt conversion rate?
It can, if you add friction. Upsells that interrupt browsing, popups on a timer and aggressive cross-sell grids on the product page all cost conversions. Offers placed after commitment — in the cart, at add-to-cart, or post-purchase — almost never do. Always watch both numbers together.
What is the difference between AOV and average basket size?
Average order value is revenue divided by orders. Average basket size usually means units per order. They move together but not always: a quantity break raises both, while an accessory upsell raises AOV more than units, and a bundle discount can raise units while flattening AOV.
Should I raise prices instead?
Do both, but they are different instruments. A price rise applies to everyone and risks conversion across the board. AOV work is opt-in — only the shoppers who want more spend more — so it carries far less downside risk while producing a similar revenue effect.